Hurst Exponent
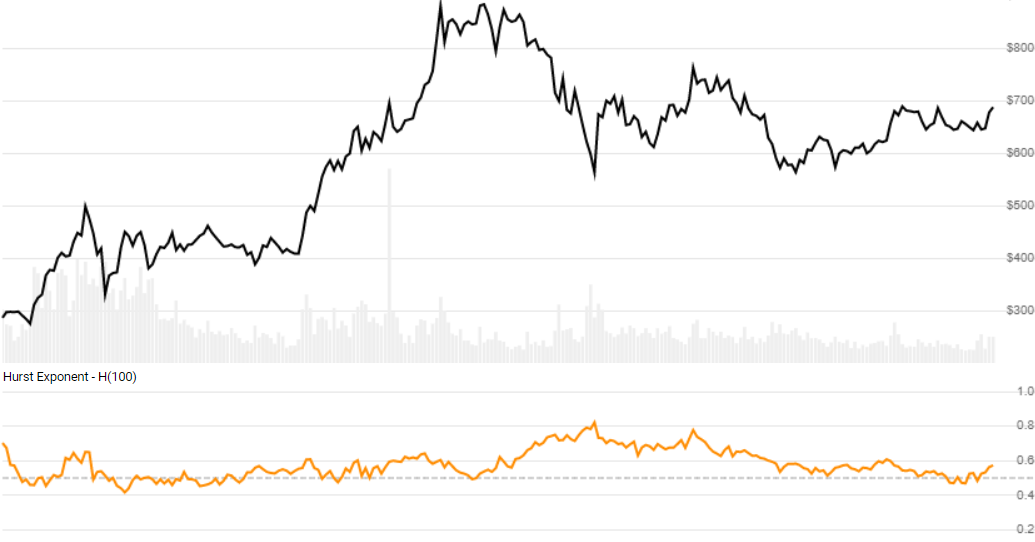
The Hurst Exponent (H) is part of a Rescaled Range Analysis, a random-walk path analysis that measures trending and mean-reverting tendencies of incremental return values. When H is greater than 0.5 it depicts trending. When H is less than 0.5 it is is more likely to revert to the mean. When H is around 0.5 it represents a random walk.
[Discuss] 💬
// C# usage syntax
IEnumerable<HurstResult> results =
  quotes.GetHurst(lookbackPeriods);
Parameters
lookbackPeriods int - Number of periods (N) in the Hurst Analysis. Must be at least 20. Default is 100.
Historical quotes requirements
You must have at least N+1 periods of quotes to cover the warmup periods.
quotes is a collection of generic TQuote historical price quotes. It should have a consistent frequency (day, hour, minute, etc). See the Guide for more information.
Response
IEnumerable<HurstResult>
- This method returns a time series of all available indicator values for the
quotesprovided. - It always returns the same number of elements as there are in the historical quotes.
- It does not return a single incremental indicator value.
- The first
Nperiods will havenullvalues since there’s not enough data to calculate.
HurstResult
Date DateTime - Date from evaluated TQuote
HurstExponent double - Hurst Exponent (H) from raw rescaled range (R/S) analysis
HurstExponentAL double - Anis-Lloyd corrected Hurst Exponent (H). Removes finite-sample bias from the raw R/S estimate. Like HurstExponent, values near 0.5 represent a random walk, greater than 0.5 depict trending, and less than 0.5 indicate mean-reverting behavior. This corrected value is generally preferred for smaller lookback periods.
Utilities
See Utilities and helpers for more information.
Chaining
This indicator may be generated from any chain-enabled indicator or method.
// example
var results = quotes
    .Use(CandlePart.HLC3)
    .GetHurst(..);
Results can be further processed on HurstExponent with additional chain-enabled indicators.
// example
var results = quotes
    .GetHurst(..)
    .GetSlope(..);
References
- Inputs are log returns
ln(c_t / c_{t-1}), which provide additive, scale-consistent increments. HurstExponent(rawH) is the slope oflog(R/S)againstlog(n)across chunk sizes, following the rescaled-range analysis of Hurst (1951) and Mandelbrot & Wallis (1969).HurstExponentALapplies the Anis & Lloyd (1976) finite-sample expectationE[R/S]_n = Γ((n-1)/2) / (√π · Γ(n/2)) · Σ_{r=1}^{n-1} √((n-r)/r), then corrects each observed R/S asR/S − E[R/S]_n + √(π·n/2)before regressing. The expected value uses an exactLogGammaevaluation forn ≤ 340and Peters’ (1994) Stirling approximation√(2 / (π·(n-1)))for largern.