Pivots
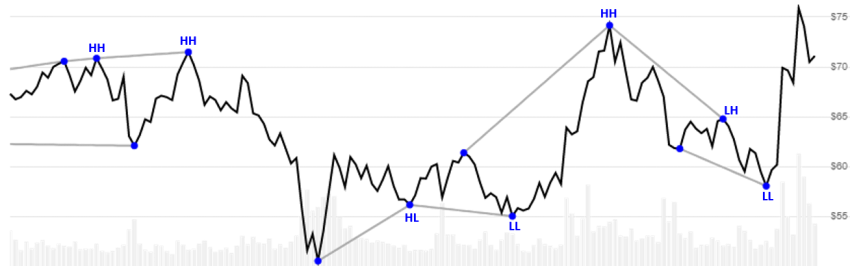
Pivots is an extended customizable version of Williams Fractal that includes identification of Higher High, Lower Low, Higher Low, and Lower Low trends between pivots in a lookback window. [Discuss] 💬
// C# usage syntax
IEnumerable<PivotsResult> results =
  quotes.GetPivots(leftSpan, rightSpan, maxTrendPeriods, endType);
Parameters
leftSpan int - Left evaluation window span width (L). Must be at least 2. Default is 2.
rightSpan int - Right evaluation window span width (R). Must be at least 2. Default is 2.
maxTrendPeriods int - Maximum lookback periods (N) for drawing trend lines between pivot points. When pivot points are further apart than this value, the trend line tracking resets. Must be greater than leftSpan. Default is 20.
ⓘ Note: This parameter controls the lookback window for trend line calculations, not the number of results returned.
endType EndType - Determines whether Close or High/Low are used to find end points. See EndType options below. Default is EndType.HighLow.
The total evaluation window size is L+R+1.
Historical quotes requirements
You must have at least L+R+1 periods of quotes to cover the warmup periods; however, more is typically provided since this is a chartable candlestick pattern.
quotes is a collection of generic TQuote historical price quotes. It should have a consistent frequency (day, hour, minute, etc). See the Guide for more information.
EndType options
EndType.Close - Chevron point identified from Close price
EndType.HighLow - Chevron point identified from High and Low price (default)
Response
IEnumerable<PivotsResult>
- This method returns a time series of all available indicator values for the
quotesprovided. - It always returns the same number of elements as there are in the historical quotes.
- It does not return a single incremental indicator value.
- The first
Land lastRperiods inquotesare unable to be calculated since there’s not enough prior/following data.
👉 Repaint warning: this price pattern looks forward and backward in the historical quotes so it will never identify a pivot in the last
Rperiods ofquotes. Fractals are retroactively identified.
PivotsResult
Date DateTime - Date from evaluated TQuote
HighPoint decimal - Value indicates a high point; otherwise null is returned.
LowPoint decimal - Value indicates a low point; otherwise null is returned.
HighLine decimal - Drawn line between two high points in the maxTrendPeriods
LowLine decimal - Drawn line between two low points in the maxTrendPeriods
HighTrend PivotTrend - Enum that represents higher high or lower high. See PivotTrend values below.
LowTrend PivotTrend - Enum that represents higher low or lower low. See PivotTrend values below.
PivotTrend values
PivotTrend.HH - Higher high
PivotTrend.LH - Lower high
PivotTrend.HL - Higher low
PivotTrend.LL - Lower low
Filtering results
Since this method returns one result per input quote (with null values where no pivot exists), you’ll often want to filter results for specific use cases:
// get only records with pivot points
var pivotsOnly = results.Condense();

// get only records with trend lines
var trendsOnly = results
    .Where(x => x.HighTrend != null || x.LowTrend != null);

// get only recent N periods
var recentPivots = results.TakeLast(period);

// get only high pivot points with Higher High trend
var higherHighs = results
    .Where(x => x.HighPoint != null && x.HighTrend == PivotTrend.HH);

// combine filters: recent periods with trends
var recentTrends = results
    .Where(x => x.HighTrend != null || x.LowTrend != null)
    .TakeLast(period);
Utilities
See Utilities and helpers for more information.
Chaining
This indicator is not chain-enabled and must be generated from quotes. It cannot be used for further processing by other chain-enabled indicators.